Loading...
Searching...
No Matches
PlottingUtils
Table of Contents
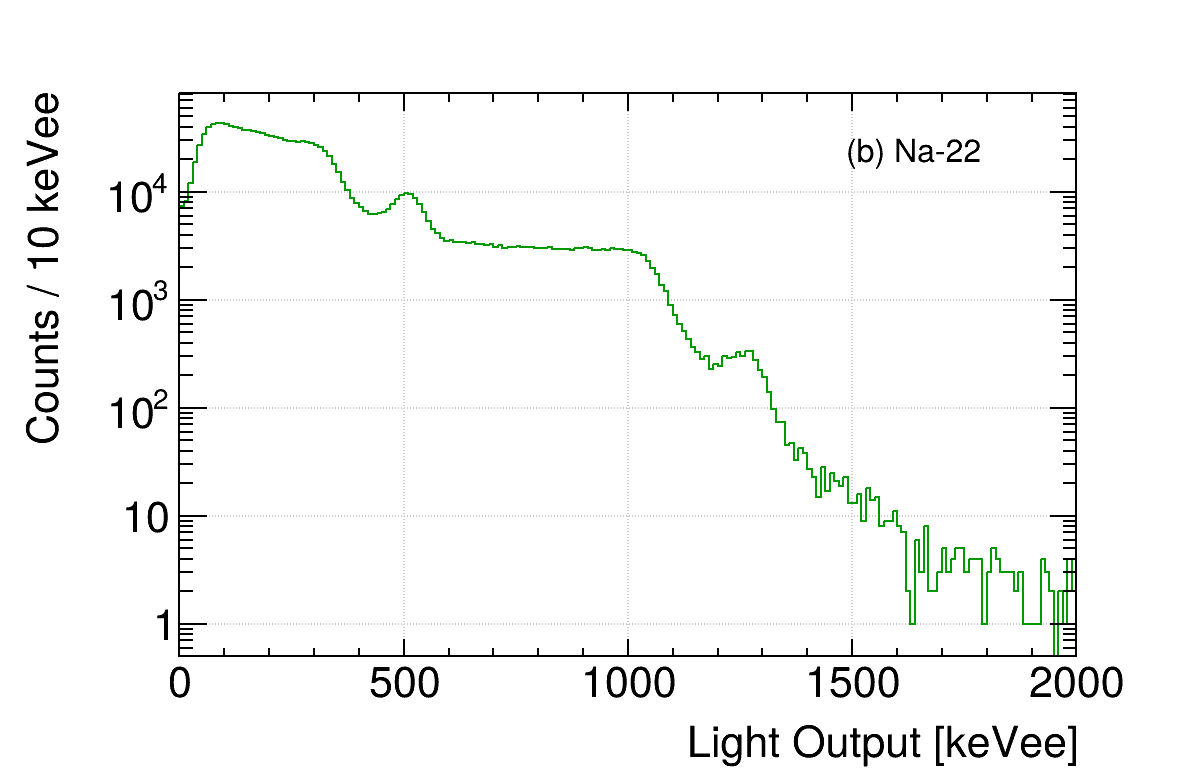
Light output spectrum example with subplot text
All-static utility class for publication-quality ROOT graphics with consistent styling. No object instantiation required.
Initialization
- SetStylePreferences(PlotSaveFormat) — must be called before using other methods (warns if not). Sets global ROOT style and chooses output format (PlotSaveFormat::kPNG or PlotSaveFormat::kPDF, defaults to PNG). Also installs a 255-color turbo palette (as in matplotlib) for 2-D color scales. Calling InitUtils::SetROOTPreferences() takes care of this and is recommended.
Canvas
- GetConfiguredCanvas(Bool_t logy) — returns a pre-configured 1200x800 TCanvas with grid and tick marks
Object configuration
- ConfigureGraph / ConfigureAndDrawGraph — set line color/width, axis label/title sizes, and offsets on a TGraph
- ConfigureHistogram / ConfigureAndDrawHistogram — same for TH1, plus fill style and axis division settings
- Configure2DHistogram / ConfigureAndDraw2DHistogram — same for TH2, enables log-z and adjusts right margin for the color axis
Annotations
- AddLegend(x1, x2, y1, y2) — returns a drawn TLegend with consistent font/border styling.
- Note
- The argument order is the extremely sane (x1, x2, y1, y2), not the ROOT default (x1, y1, x2, y2).
- AddText(label, x, y, angle) — returns a drawn TLatex in NDC coordinates for arbitrary annotations (e.g. subplot labels like "(a)", "(b)"). Optional angle (default 0) sets text rotation in degrees.
Output
- SaveFigure(canvas, name, subdirectory, PlotSaveOptions) — saves to <plots_base>/ (or <plots_base>/<subdirectory>/ if specified) using the format set in SetStylePreferences. The base defaults to "plots" (CWD-relative) and is configurable via SetPlotsBaseDir or InitUtils::SetROOTPreferences. Parent directories are created automatically. PlotSaveOptions controls linear (kLINEAR), log (kLOG), or both (kBOTH, default). Log variants are prefixed with log_. A PDF gets an unrotated page with the canvas's own shape, so it can go straight into LaTeX.
- SetPlotsBaseDir(dir) / GetPlotsBaseDir() — set/inspect the plot output base directory. Trailing slashes are stripped on set. Pass an absolute path so output is anchored to a project root regardless of CWD.
Utilities
- GetDefaultColors() — returns a 24-color palette of distinct ROOT colors
- GetRandomName() — generates a random canvas name to avoid ROOT name collisions